

How to Draw Market Structure with a Rules-Based Approach
It’s no secret that one of the most high-return and successful styles of trading taught for contemporary markets is the application of smart money concepts.
This is the art of analyzing where institutions with deep pockets and massive order sizes place their trades. Then take those trades alongside them rather than against them.
If you find yourself wanting to learn how to trade smart money concepts or if you’re already well on the path to profiting through this effective approach, then it’s likely you’ve learned a thing or two about market structure.
Accurately drawing market structure is the most important step to successfully applying smart money concepts and it’s also one of the hardest to master.
This article will help you understand what market structure is, how to draw it, some of the common mistakes you should avoid when drawing market structure, and a step-by-step approach to easily draw market structure in an objective (rather than subjective) way. I’m going to teach you the mechanical process I use to draw market structure for my own trading and help you clearly understand how to do so for yourself. Let’s begin!
What Is Market Structure?
To recap, market structure is the underlying trend and direction of price movement.
When looking at price over time as it’s drawn visually, an uptrend is considered a series of higher highs and higher lows.
A downtrend, conversely, is a series of lower lows and lower highs.
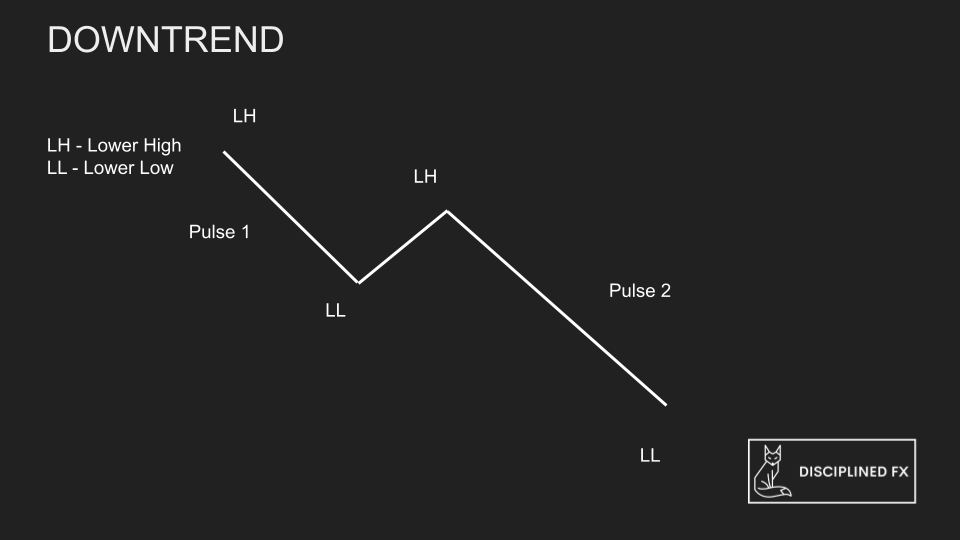
When a market is in a trend, it’s assumed price will continue to go the same way until a previous retracement is broken.
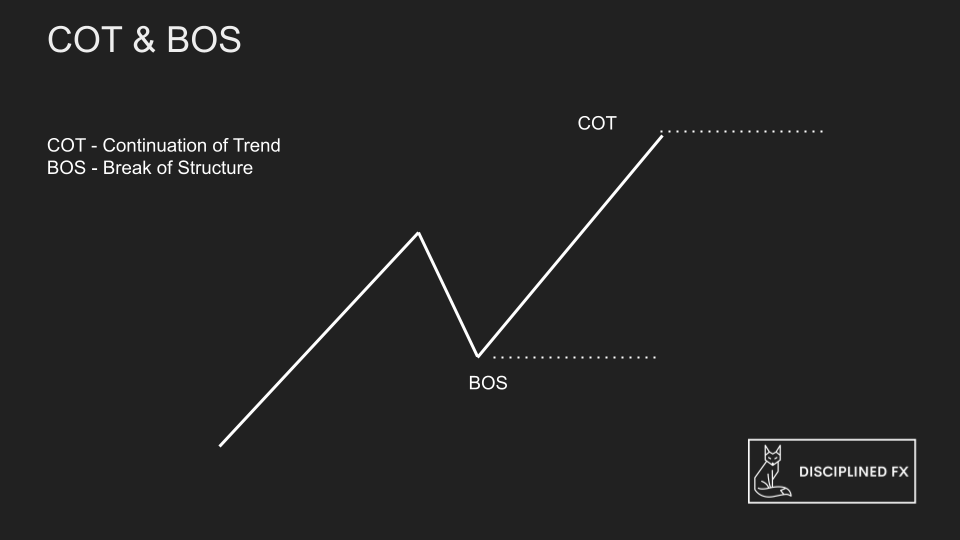
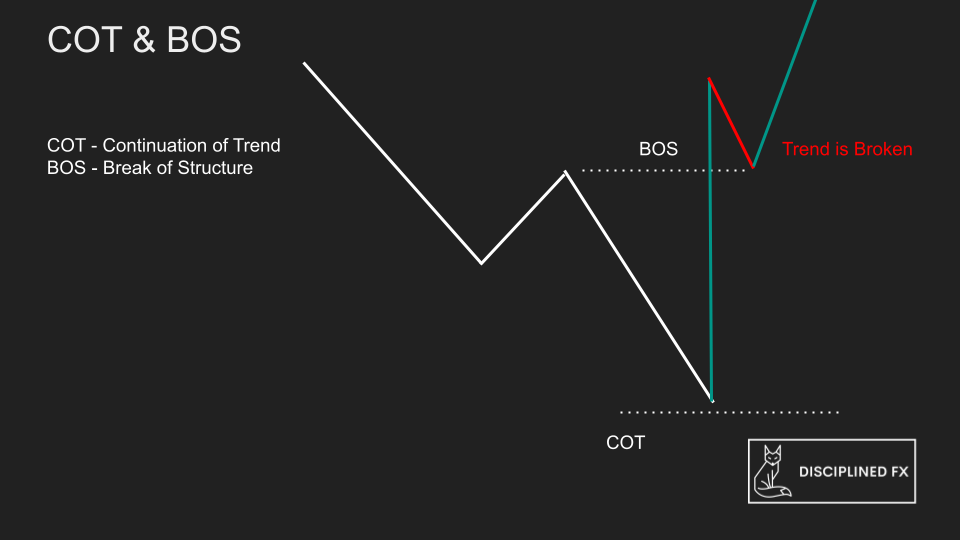
So with the example of an uptrend, if price were to come back and break through the previous higher low, then this trend is considered broken and price will likely begin a downtrend or oscillate in a ranging market from that point.
When market structure is accurately drawn, it’s possible to make profit by entering on pullbacks and exiting with the next wave in direction of the trend, like so.
<<<By the way, want to use the best company for receiving payouts for successful smart money concepts trading? Check out FT+! Use “DFX10” for 10% Off Your Challenge!>>>
Common Mistakes When Drawing Market Structure
This model of market direction is easy to understand and makes complete sense when describing price action by drawing these clean arrows. It may also appear logical when drawing market structure on past data in hindsight. But when we look to live charts, it can be much more complicated to determine where market structure is continuing or breaking.
Many traders subjectively draw market structure as they see fit. Often, traders will draw a pullback or breakout with nearly every change of candle color.

Here’s a common example of how a trader might subjectively draw market structure on a live chart. If we fast-forward a bit, we can see how this trend looks like it’s broken.

If you’re trading smart money concepts, then this may seem like a good area to start shorting against the trend, by placing a trade like so.

However, if we fast forward a second time, we can see that the market is actually still in an uptrend!

How to Draw Market Structure
So how can we possibly know when a pullback is over or where to accurately draw the pullback wave?
The key is to focus on pullbacks that have enough evidence or “weight” to be considered a valid pullback and to focus on continuation of structure (AKA “break outs”) that have enough price power behind them to be deemed valid.
With a handful of rules that follow these underlying principles, the above example would have a more accurate market structure that looks like this:

See how much cleaner this market structure looks?
And you would have profited with a trade that focused on entering with the trend, like so:
The way I learned how to draw market structure with greater precision involves simple rules for designating valid pullback waves and valid breakout movements.
For the purpose of this article, I’m going to focus on teaching you how to draw market structure, so if you’d like to learn more about how to trade off of market structure levels for high-probability profit, then I invite you to join and learn how to do so in the Disciplined FX Scalping Course.
Draw Market Structure According to a Rules-Based Model
Here’s how to draw market structure in a nutshell:
-
Draw valid pullbacks
-
Draw valid breakouts
Let’s go over the rules for each one. I’m going to teach you by using an uptrend as our example, but you can apply the same rules to a downtrend, just inverted.
To draw a valid pullback, we want to focus on areas that will most likely have a lot of big orders where institutions are accumulating entries into the market.
Remember, when big money comes into the market, it leaves a footprint. When orders cost millions of dollars, they’re not taken with one singular order (otherwise the market would move too much from the displacement!).
Instead, big money needs to enter gradually, over a series of many smaller orders. This also will show some push and pull even done on a smaller scale.
Thus, one little pullback candle isn’t likely a sign of big money entering the market. So too, a tight ranging area might not be the right place.
We want to see the markets pullback from the recent high with a bit of conviction.
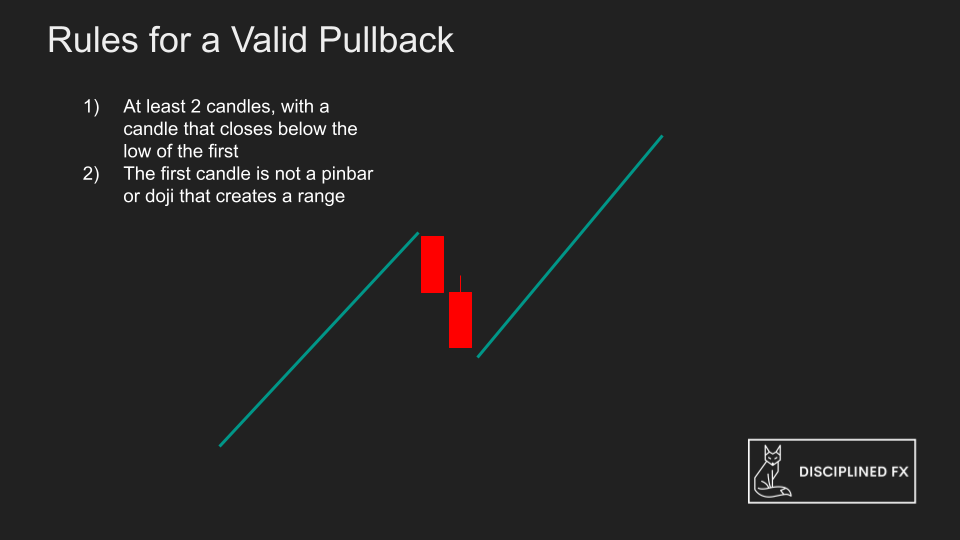
One way we can make a rule for this is to consider pullbacks that are at least two candles closed opposite the trend, the second further from the first.
This is an example of a valid pullback.
These are not valid pullbacks.
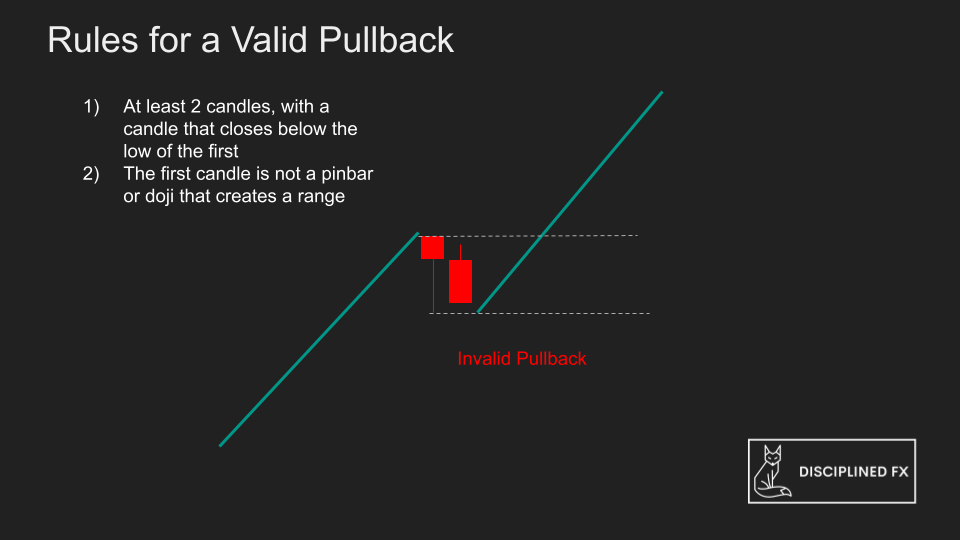
We also want to make sure that the second pullback candle closes outside of a range. So if the first candle makes a pinbar, then the candle that follows need to be sure to close outside of that candles low. The low of the second candle isn’t the signal, it must be the close. So these series of lows don’t count.
From our example chart, here is a valid pullback. The boxed area is an invalid pullback because there isn’t another candle that closes below the first pullback candle.

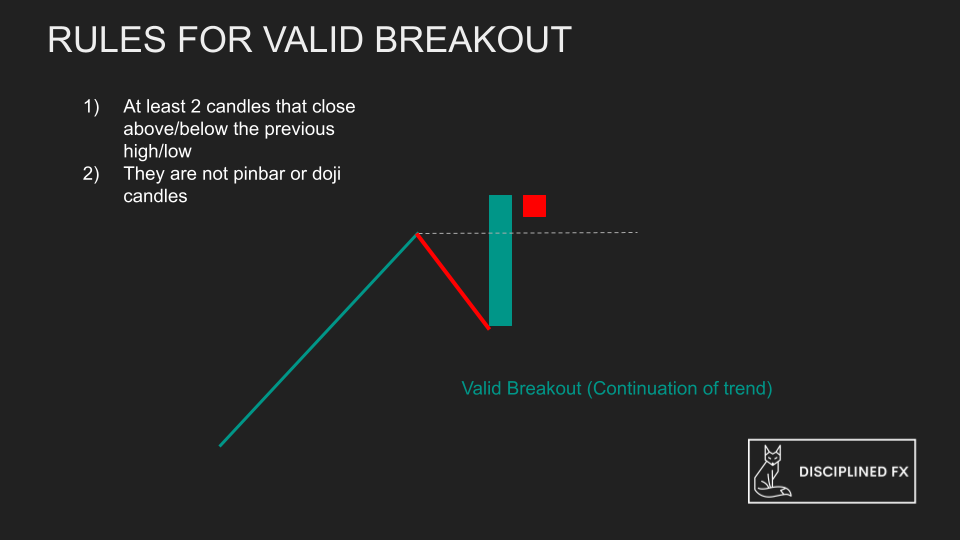
Now for the rules of a valid breakout.
With a breakout, we want to be sure that the market intends on moving higher and isn’t just making a fake breakout to trick traders into buying.
Therefore, we want to see at least two candles close outside of the previous high.
Here’s an example:
It doesn’t count if the second candle opens above the previous high but closes back below that previous high price. Also, the highs of candles that don’t close above the breakout area now create a range from which we want to see a break out of. Even if we see one candle validly break out of the previous high, the next valid breakout candle must close beyond these candle highs.
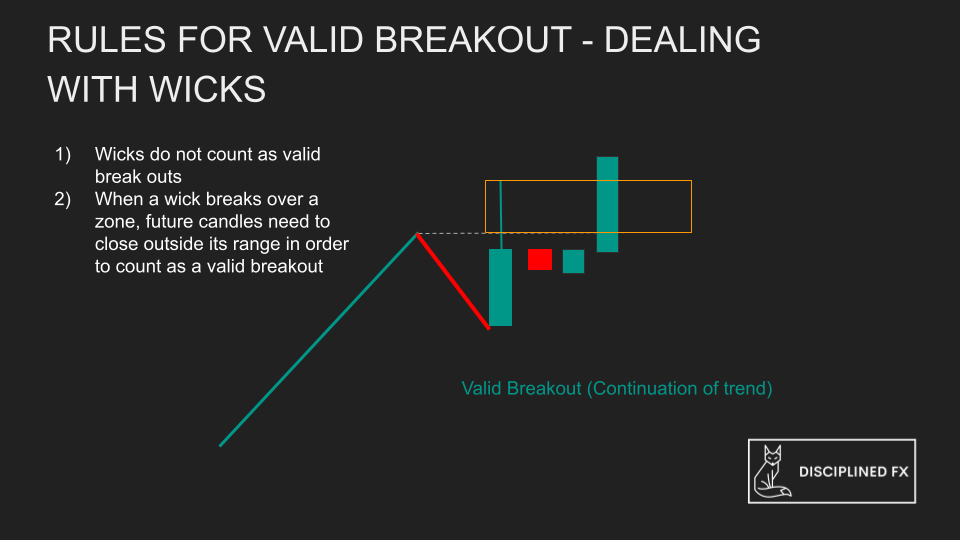
Here’s a valid breakout from our example trade. In the box is an example of a fake breakout.

So using these two sets of rules for valid pullbacks and valid breakouts, you can now see how we can avoid a lot of noise on the charts and focus on the strongest areas of underlying market structure.
This model helps us drastically simplify chart analysis and allows us to focus on areas where price will most likely react.
It’s important to note that this model is not perfect.
It just gives us a “probabilistic” edge. Sometimes the market is more volatile than other times. Higher time frames may respect these rules better than lower ones.
These rules, however, allow us to focus on best-case areas and to simplify a typically subjective and haphazardous analytical process.
Try it out for yourself! Backtest on your own charts and see if this rules-based approach to drawing market structure helps you better understand the underlying trends on the charts.
As always, I wish you nothing but the best of strength and luck in your trading!


